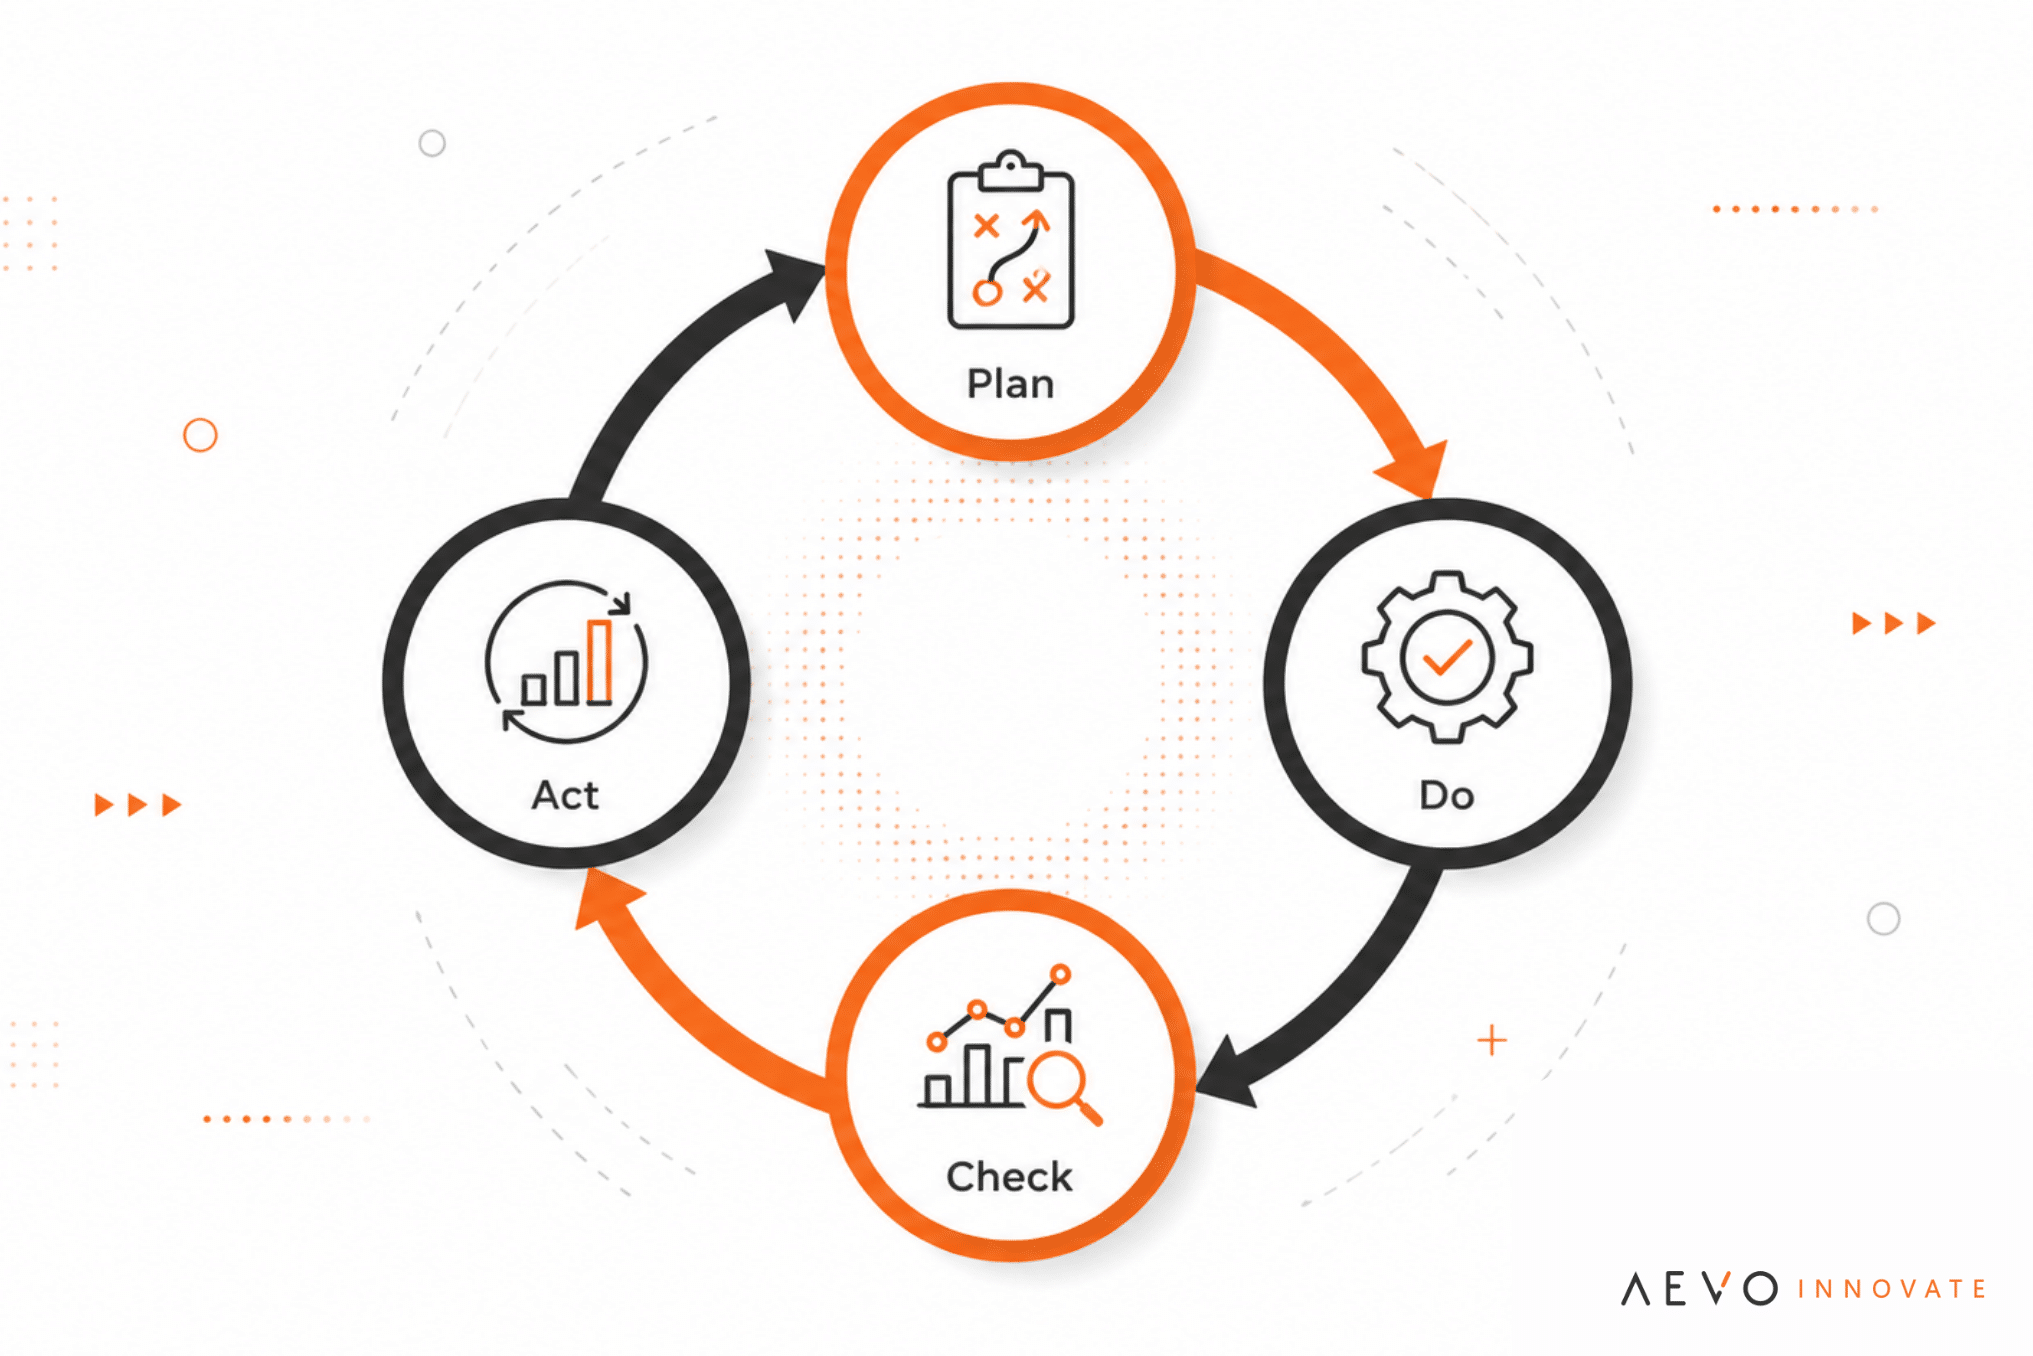
For innovation managers, one question always comes up: How can I prove the impact of our idea management program?
Tracking numbers alone isn’t enough. Success lies in connecting metrics to business outcomes. That’s where KPIs for idea management come in. These indicators transform innovation from an abstract concept into a measurable business driver, revealing whether your program truly generates value or just activity.
Listen to this blogpost’s summary here:
In this article:
- Why KPIs Are Critical in Idea Management
- Beyond Quantity: Measuring Impact, Not Just Volume
- The 10 Most Relevant KPIs for Idea Management
- Case Examples: KPIs for Idea Management in Action
- Building a KPI Framework that Works
- Turning Data into Decisions
- Start Measuring What Matters
- Conclusion
Why KPIs Are Critical in Idea Management
Many companies still treat idea management as a creative exercise rather than a strategic system. But without KPIs, it’s impossible to:
- Demonstrate ROI to executives
- Optimize resource allocation
- Compare forecast vs. actual results
- Identify bottlenecks in your idea pipeline
According to McKinsey, organizations that consistently measure innovation through structured KPIs are more likely to achieve sustained growth.
In short: what gets measured, gets managed; and improved.
Beyond Quantity: Measuring Impact, Not Just Volume
A common trap for innovation managers is celebrating the number of ideas submitted or campaigns launched. These metrics are valuable, but only if they translate into impact.
You need a clear distinction between activity KPIs (volume) and outcome KPIs (results):
| Type | Focus | Example KPI | Strategic Insight |
|---|---|---|---|
| Volume | Inputs and engagement | Number of ideas submitted | Measures participation and culture |
| Impact | Results and value | ROI from implemented ideas | Shows tangible business contribution |
True maturity in idea management comes when companies move from “How many ideas?” to “Which ideas deliver value?”
The 10 Most Relevant KPIs for Idea Management
Below are the 10 strategic KPIs for idea management to evaluate an idea management program from end to end. From participation to financial return.
1. Idea Submission Rate
Formula: (Number of ideas submitted ÷ Total employees) × 100
Indicates the organization’s overall engagement. A healthy program maintains a rate of 5–10% of employees submitting at least one idea per quarter. If participation is low, it may point to weak communication or sponsorship.
Learning more: Idea Management Software | AEVO Innovate
2. Approval Rate
Shows the percentage of ideas approved for implementation.
A very low rate might suggest poor idea quality or overly strict filtering criteria.
Benchmark: 10–20% of ideas approved = balanced pipeline.
3. Implementation Rate
Measures execution capability. It’s not about how many ideas you collect, but how many are actually implemented. According to innovation benchmarking studies, fewer than 10% of submitted ideas typically make it all the way to implementation revealing that the real challenge lies in execution, not generation.
4. Employee Engagement Score
Tracks motivation and satisfaction among participants. Surveys or participation trends can measure how innovation is perceived internally. Programs with visible recognition mechanisms show +30% higher engagement.
5. Time-to-Implementation
How long does it take for an idea to go from submission to execution?
This KPI identifies bottlenecks and process agility. A shorter time means a more responsive, efficient organization, a major advantage in industries like manufacturing or retail.
6. Return on Innovation Investment (ROI²)
Formula: (Total financial gain – investment cost) ÷ investment cost
This is the ultimate KPI for executives, as it shows whether innovation pays off.
For instance, Aeris Energy achieved 6.8× ROI using AEVO Innovate’s Idea Management platform, turning process improvements into R$700,000 in annual savings.
7. Cost Savings Generated
Tracks the financial impact of implemented ideas. In manufacturing, process improvements and waste reduction can represent millions in recurring savings, directly impacting EBITDA (Earnings Before Interest, Taxes, Depreciation, and Amortization).
8. Idea Cycle Efficiency
Measures how efficiently ideas progress through stages. If only 10% reach implementation, review your evaluation process. Healthy programs maintain abalanced funnel, filtering ideas without discouraging participation.
9. Business Impact per Idea
Evaluates the average value generated per implemented idea: revenue growth, cost reduction, risk mitigation, or ESG impact. Example: a logistics company may track fuel savings per optimization idea to quantify operational outcomes.
10. Innovation Vitality Index
Inspired by 3M’s model, this KPI measures the percentage of revenue from new initiatives (typically <3 years old).
It indicates how strongly innovation contributes to top-line growth.
Case Examples: KPIs for Idea Management in Action
Nestlé – Scaling Open Innovation
With AEVO Innovate’s platform, Nestlé engaged 5,000 employees across 20+ challenges and achieved 90% approval rates. By tracking participation and conversion KPIs, the company replicated best practices across multiple plants worldwide.
Sicoob Credicom – Measuring Financial Outcomes
The cooperative connected its KPIs for idea management to business results:
- 81% employee engagement
- R$2.3M revenue growth
- R$2.1M cost reduction
Result: nearly R$5M in impact from innovation initiatives; all tracked through measurable KPIs.
Aeris Energy – Operational ROI
In manufacturing, Aeris Energy structured its KPIs around operational improvement.
Outcome: R$1.5M projected results and 6.8× ROI, proving that structured measurement transforms ideas into business performance.
Building a KPI Framework that Works
To make KPIs actionable, they must be:
- Aligned with business goals
- Balanced between quantity, quality, and impact
- Continuously monitored via dashboards
- Transparent to all stakeholders
- Reviewed annually for refinement
Without this structure, KPIs risk becoming “Key Performance Inhibitors”, that is, numbers that mislead more than they guide.
Turning Data into Decisions
The real power of KPIs for Idea Management lies not in the numbers, but in how you use them.
With the right indicators, you can:
- Identify high-impact ideas early
- Justify budgets with hard data
- Recognize contributors effectively
- Strengthen the link between innovation and corporate strategy
Start Measuring What Matters
According to Gartner, by 2025, 75% of enterprises will integrate AI-driven analytics into innovation strategies, shifting from descriptive dashboards to predictive ones.
That’s the future of measurement: intelligent systems that anticipate performance, not just report it.
Download AEVO’s free Idea Management KPI Spreadsheet and get:
Measuring your idea management program’s success doesn’t have to be complex.
You just need clarity on what drives value, and tools to track it effectively.
Download AEVO’s free Idea Management KPI Spreadsheet and get:
- A ready-to-use dashboard with the most relevant KPIs
- Editable templates for your own idea program
- Automatic progress and ROI tracking
Before we wrap up, here’s a quick video summary of today’s key insights.
If you want to understand how to track the real impact of your idea management program (from participation to ROI) this recap will walk you through the 10 essential KPIs for Idea Management and show how leading companies turn data into measurable innovation results.
Conclusion
In innovation management, numbers tell a story, but only if you know how to read them.
KPIs for idea management go beyond tracking activity; they reveal how innovation truly creates value.
Organizations that master these indicators don’t just collect ideas; they transform them into measurable business impact, improving efficiency, profitability, and employee engagement.
Building a data-driven innovation culture means that every idea, no matter how small, can be connected to a real outcome. And that’s how innovation earns its rightful place in the strategic agenda. Not as a cost, but as a growth engine.
Start monitoring your key metrics and prove how innovation creates measurable impact in your organization.