Every manufacturer claims to pursue efficiency, but only a few truly measure and manage their manufacturing losses systematically. In most factories, productivity leaks occur daily, not because of major breakdowns, but because of invisible inefficiencies buried in routines, assumptions, and disconnected data.
World Class Plants stand out not because they eliminate all manufacturing losses, but because they see what others overlook. They make every deviation visible, quantify impact, and connect frontline insights to continuous improvement cycles.
In this article, we’ll explore the five types of manufacturing losses that separate high performers from the rest, and how Continuous Improvement (CI) tools like Lean, PDCA, and Loss Intelligence can turn those gaps into gains.
Table of Contents
Here is a summary audio of today’s reading:
1. Machine Losses: Where Uptime Disappears
Unplanned downtime, slow changeovers, and equipment inefficiency form the biggest share of industrial waste. Studies show that up to 40% of productivity loss in plants comes from machine-related manufacturing losses, most of which are predictable and preventable.
Common examples include:
- Unplanned breakdowns caused by reactive maintenance
- Long setup or changeover times (often due to lack of SMED application)
- Reduced operating speed and micro-stops unnoticed by operators
World Class Plants approach these differently:
They measure every minute of downtime through automated data collection and categorize losses using a structured Loss Dictionary: a taxonomy that defines what constitutes a breakdown, setup delay, or idle time.
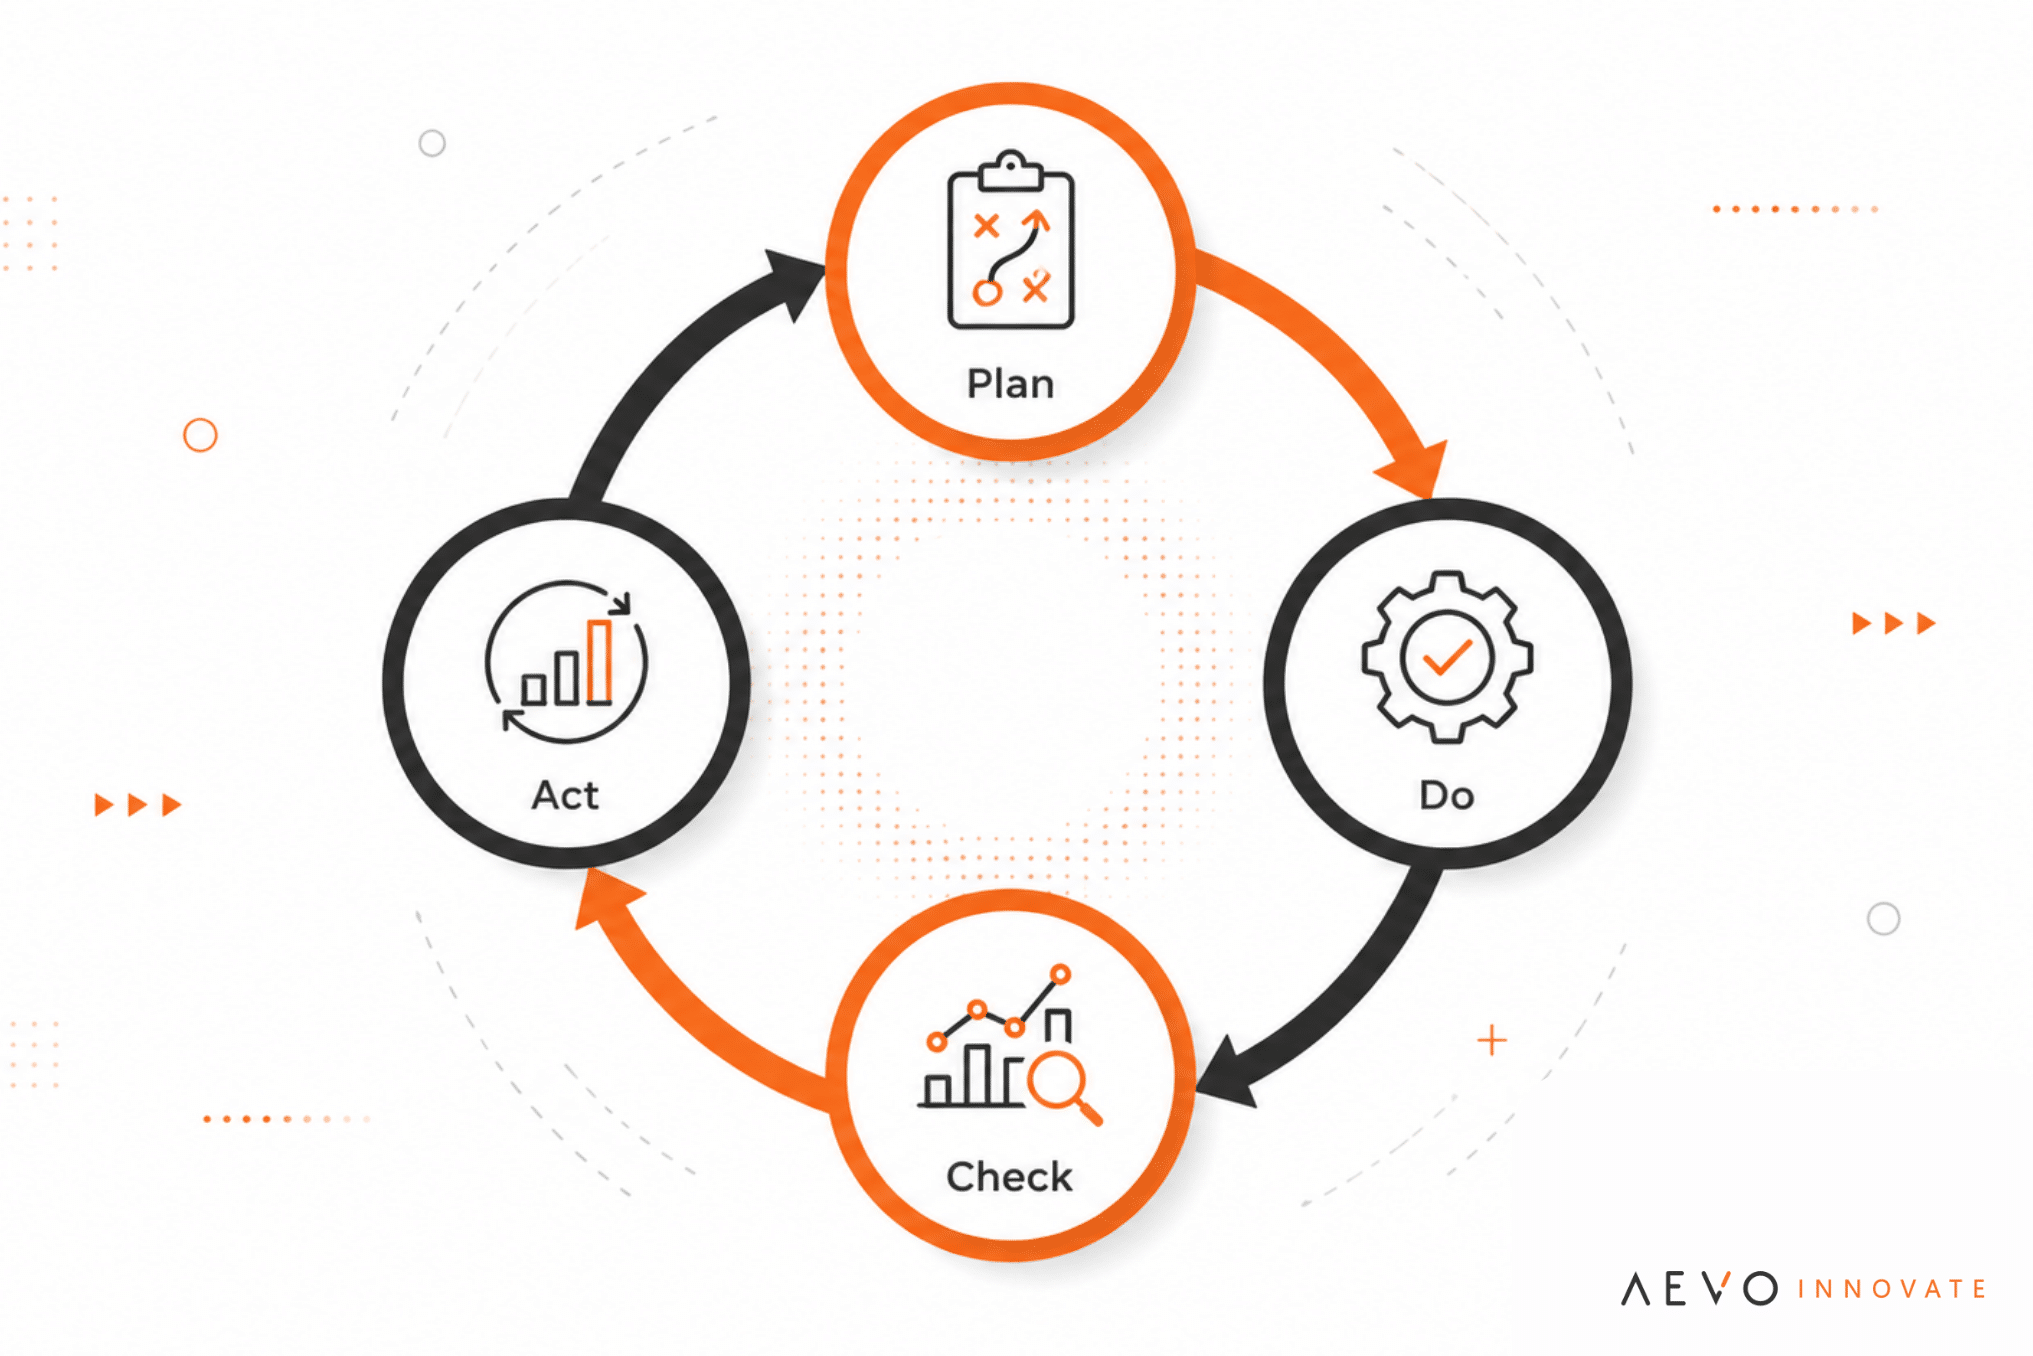
Once losses are quantified, teams apply Root Cause Analysis and Kaizen to address systemic issues, not just symptoms. Tools like PDCA ensure that corrective actions are tested, standardized, and monitored continuously.
Takeaway: If you can’t see your downtime in real time, you can’t reduce it. Visibility is the first step toward operational excellence.
2. Manpower Losses: The Human Cost of Inefficiency
People are a plant’s most valuable (and most under-optimized) asset. Yet, in many operations, employees spend hours waiting for instructions, materials, or approvals. This “human downtime” is one of the hardest manufacturing losses to detect because it hides behind multitasking and daily firefighting.
Typical causes include:
- Poor work distribution and unbalanced task allocation
- Communication delays between shifts or departments
- Repetitive administrative work without automation
World Class Plants invest in Gemba Walks: structured, cross-functional visits where leaders observe operations directly on the shopfloor. These walks reveal inefficiencies that dashboards often miss: unnecessary motion, redundant approvals, or ergonomic barriers.
Additionally, organizations applying Lean principles such as Standardized Work and 5S report measurable results:
- 25% improvement in operator productivity
- 30% reduction in motion waste
- Higher engagement, as employees actively participate in problem-solving
Takeaway: Empowering teams to identify and fix their own inefficiencies builds ownership, and accelerates improvement far beyond what top-down initiatives can deliver.
3. Material and Energy Losses: The Hidden Cost Drivers
Material waste isn’t limited to scrap on the floor, it includes overconsumption, rework, and inefficiencies in energy use. In many plants, energy costs represent up to 15% of total production expenses, yet few track where those manufacturing losses actually occur.
Examples of hidden losses include:
- Excess raw material usage
- Overprocessing (extra polishing, painting, or packaging)
- Poor equipment calibration leading to rework or defects
- Compressed air leaks, idle running motors, and inefficient lighting systems
World Class Plants link these manufacturing losses directly to sustainability metrics. Using digital dashboards, they connect data from sensors and ERP systems to monitor scrap rates, energy peaks, and carbon emissions in real time.
When mapped through Value Stream Mapping (VSM), energy and material flows reveal unexpected hotspots. Combined with Lean’s 8 Wastes (particularly Overprocessing and Defects), these insights allow for precise improvement actions.
Takeaway: What gets measured gets optimized. Integrating energy and material losses into CI initiatives aligns cost reduction with sustainability goals; a key differentiator in modern manufacturing.
4. Process and System Losses: When Structure Becomes the Bottleneck
Even with efficient machines and skilled operators, process design can be the silent killer of performance. Many manufacturing losses stem not from what people do, but from how work is structured.
Common examples include:
- Complex approval chains delaying production decisions
- Poorly defined maintenance or quality workflows
- Lack of standardization across similar product lines
- Information gaps between systems (ERP, MES, quality tracking)
World Class Plants address this through Business Process Improvement (BPI) frameworks, a methodical approach that combines data analysis, process mapping, and iterative redesign.
The PDCA cycle and Business Process Management (BPM) methods ensure improvements are not one-time fixes but part of a repeatable structure.
Takeaway: The biggest productivity leak isn’t always on the factory floor. Sometimes it’s in the invisible friction between systems and departments.
5. Cultural Losses: When Improvement Isn’t Everyone’s Job
The final (and perhaps most underestimated) type of manufacturing loss lies in culture. When continuous improvement is seen as a side project rather than a shared responsibility, results plateau.
Cultural losses occur when:
- Employees fear suggesting changes or raising problems
- Managers reward firefighting more than prevention
- Teams focus on output instead of learning and innovation
World Class Plants close this gap by cultivating Loss Intelligence, a discipline where every operator is trained to recognize, quantify, and react to inefficiencies.
They organize cross-functional loss review meetings, where maintenance, operations, and quality teams analyze root causes together; not to assign blame, but to design smarter systems.
This approach mirrors Kaizen culture: small, daily improvements that compound into major productivity gains. When tracked in innovation platforms like AEVO Innovate, these micro-initiatives become part of a transparent portfolio, linking loss reduction directly to business impact.
Takeaway: Sustained improvement depends on mindset, not methods. When everyone owns the process, continuous improvement becomes self-sustaining.
Summary Table: 5 Types of Manufacturing Losses and How to Eliminate Them
| Type of Loss | Typical Causes | Impact on Operations | Key CI Tools and Methods |
|---|---|---|---|
| 1. Machine Losses | Unplanned downtime, long setups, poor maintenance planning | Reduced uptime, lower OEE, unpredictable schedules | PDCA, SMED, Root Cause Analysis, Autonomous Maintenance |
| 2. Manpower Losses | Idle time, poor communication, repetitive manual tasks | Low productivity, disengagement, inconsistent performance | Gemba Walk, Standardized Work, 5S, Visual Management |
| 3. Material & Energy Losses | Overconsumption, rework, scrap, inefficient energy usage | High operating costs, waste, environmental impact | Value Stream Mapping, Kaizen, The 8 Wastes of Lean, Digital Dashboards |
| 4. Process & System Losses | Complex workflows, poor data flow, lack of standardization | Bottlenecks, rework loops, slow decision-making | Business Process Improvement (BPI), BPM, PDCA, Cross-functional Reviews |
| 5. Cultural Losses | Lack of ownership, fear of change, short-term focus | Missed opportunities, low engagement, weak innovation | Kaizen Events, Loss Intelligence, Idea Management Systems (AEVO Innovate) |
How World Class Plants Build Loss-Resilient Operations
So, what truly sets World Class Plants apart? Beyond tools and technology, it’s their operational intelligence. That is, the ability to connect data, people, and improvement systems into one loop.
Here’s how they do it:
- Define every loss clearly through a shared Loss Dictionary
- Automate tracking using real-time dashboards for downtime, waste, and energy
- Integrate CI tools like PDCA, Kaizen, and Gemba Walks into daily operations
- Engage operators in identifying losses and designing local improvements
- Benchmark continuously against global peers to track progress
- Reward sustainability, not firefighting. Celebrating small wins that last
World Class Plants don’t chase perfection. They build systems where losses become visible, measurable, and fixable.
Need a refresh? Here is a video for you:
Conclusion
The difference between average and world-class manufacturing doesn’t lie in technology alone. It lies in how companies connect Continuous Improvement, loss visibility, and cultural discipline into one cohesive system.
Each hidden loss is an opportunity to reclaim time, resources, and profitability. When tracked systematically and acted upon with data and teamwork, small improvements deliver exponential returns.
With AEVO Innovate, organizations gain a digital backbone for this transformation, integrating idea management, CI workflows, and real-time analytics to turn every identified loss into measurable value.
Because world-class performance isn’t a goal; it’s a system you build, one improvement at a time.